USDA Food Composition Analysis
Problem Statement:
Analyze USDA food composition data for Vitamins, Minerals and Macronutrients.
-
Cluster identification- Is it possible to group the foods into distinct clusters according to how similar they are across all macronutrients, vitamins and minerals quantities recorded in the data?
-
Clusters vs. labels. Once a set of clusters has been found, how do the clusters compare to the food groups recorded in the data (e.g., Poultry, Dairy and Egg, Fruits) (see the field “FdGrp_Desc”)? Do food belonging to the same food group fall in the same clusters? Are there foods that belong to the same food group but fall into different clusters (that is, same food group but different food composition)? Are there foods that belong to different groups but fall into the same cluster (that is, different food groups but similar food composition)?
-
Outliers. Are there any foods that tend to be different from all the others (that is, they are outliers)? What is unique about them? What makes them unique?
-
Interpretation. For the clusters and outliers identified above, what aspects of their food composition make them different from the others and similar to the food that belong to the same cluster (that is, what makes a cluster (or outlier) unique in terms of their data values and distribution and how does it compare to the other clusters)?
Dataset : dataset
Clustering:
We ran TSNE on the dataset with the relevant columns, and identified clusters via K-means clustering. Elbow method was used to identify optimal cluster number: k=12
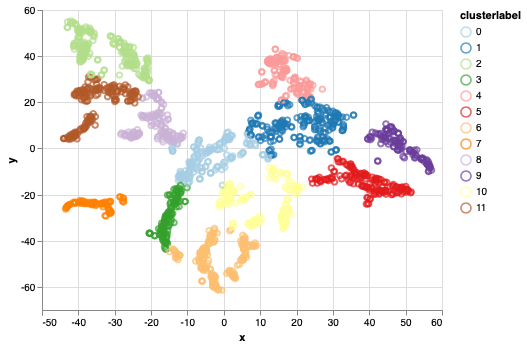
After TSNE :
Clustering by Vitamins :
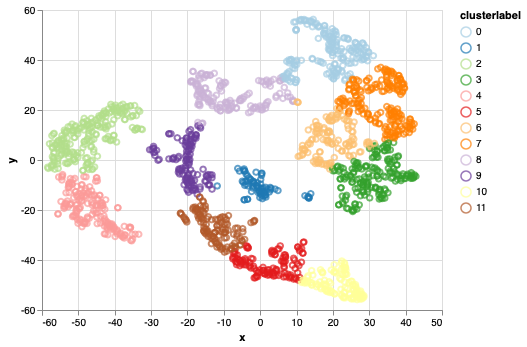
Clustering by Minerals :
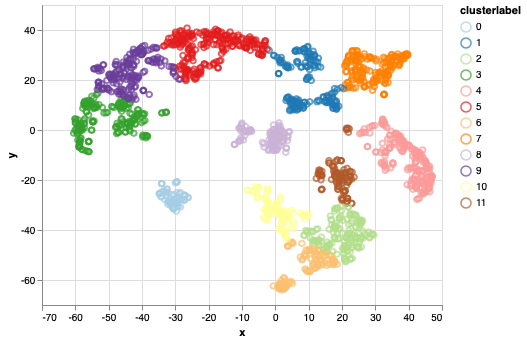
Clustering by Macronutrients :
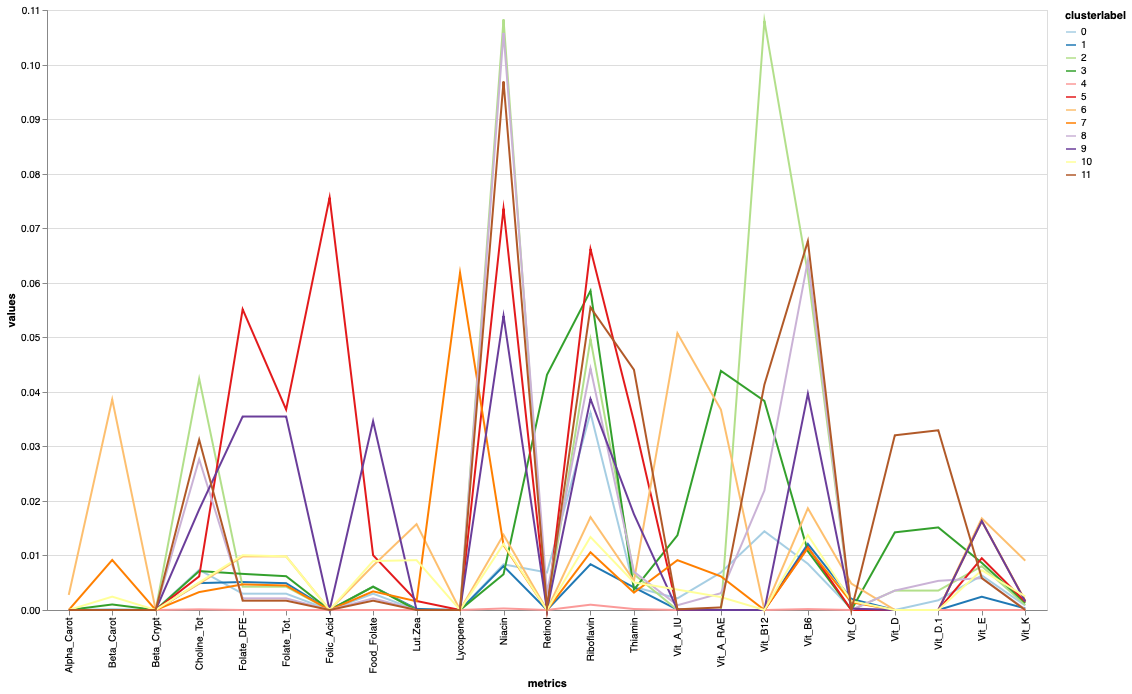
Clusters Explained By Its Nutrients:
We plotted the median of all nutrients in a cluster to analyze the cluster wise spread of nutrients. The data was normalized in preprocessing stage.
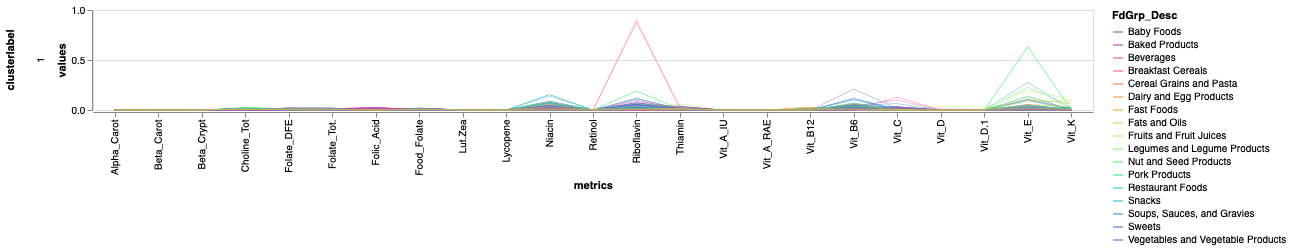
Vitamins Clusters explained :
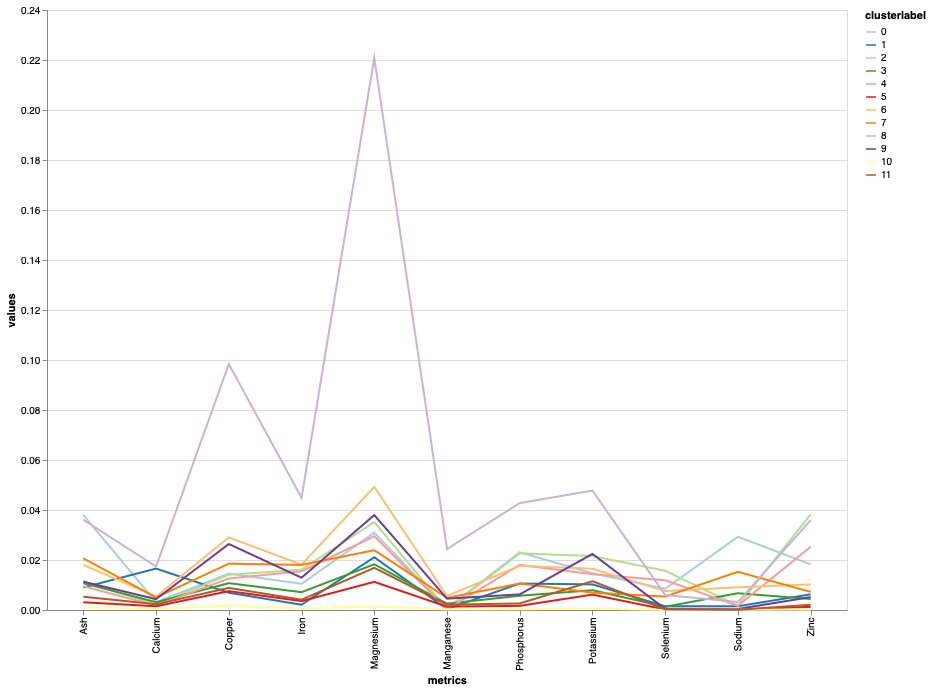
Minerals Clusters explained :
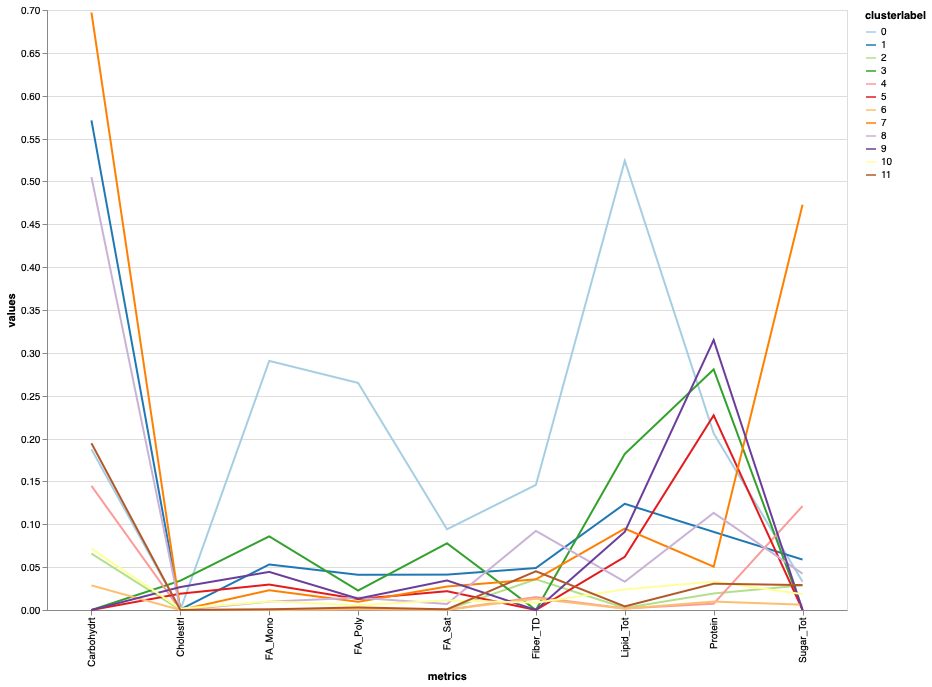
Macronutrients Clusters explained : :
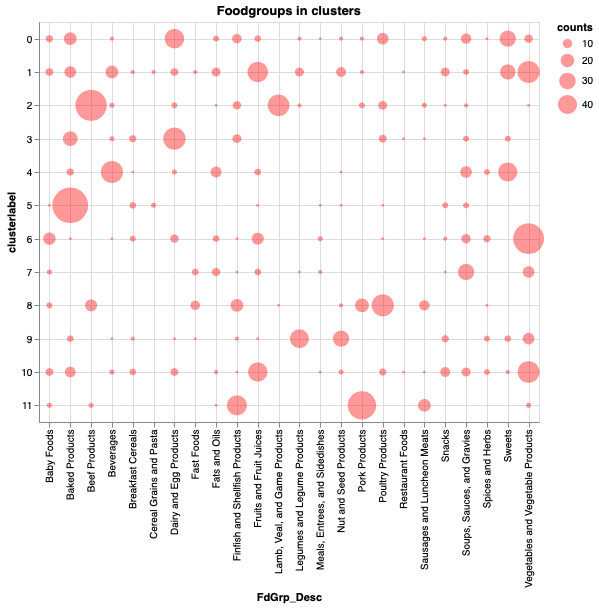
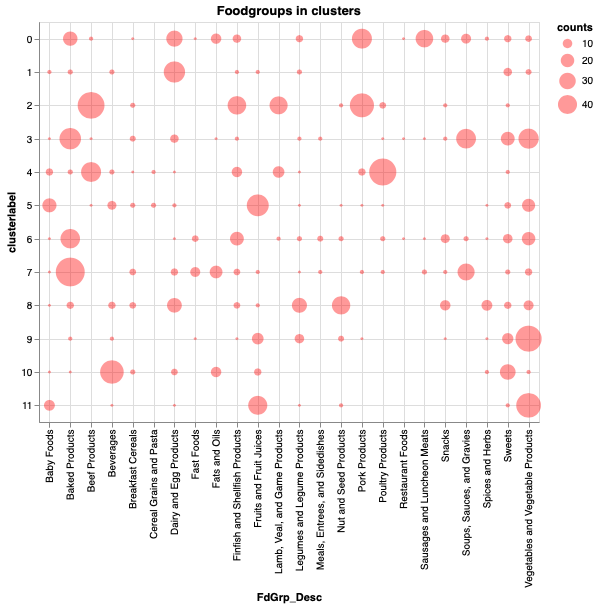
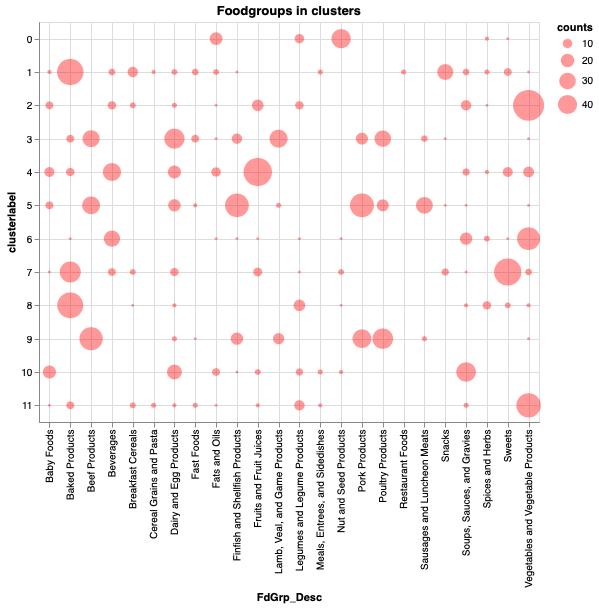
How do Clusters compare to different foodgroups:
Outlier Detection and Interpretation:
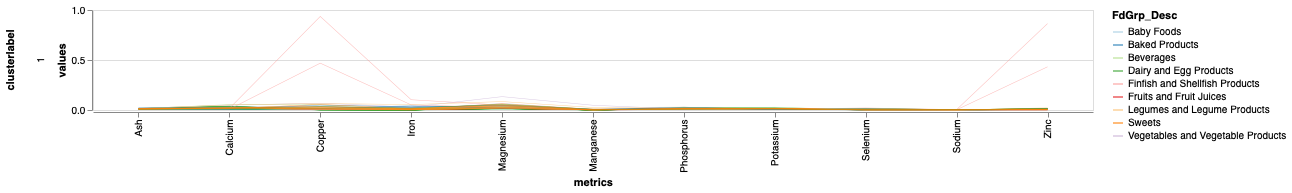
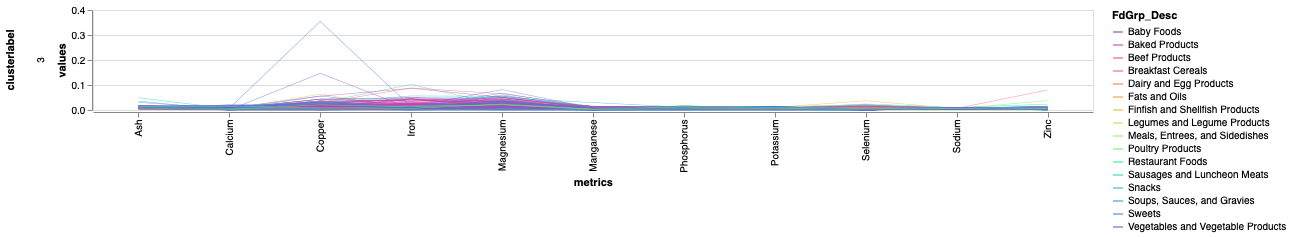
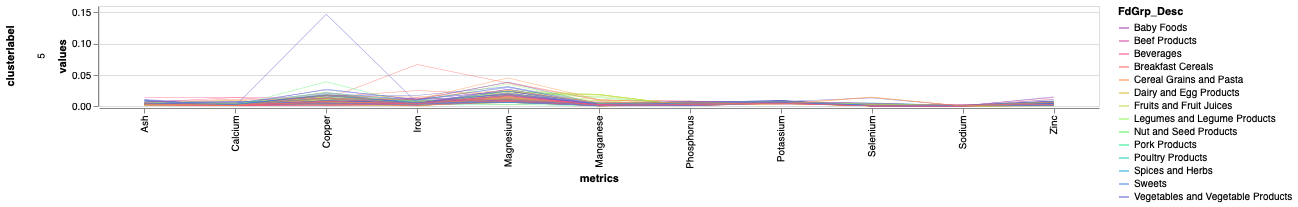
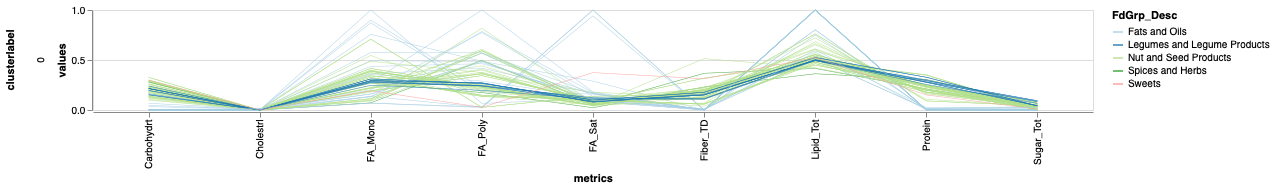
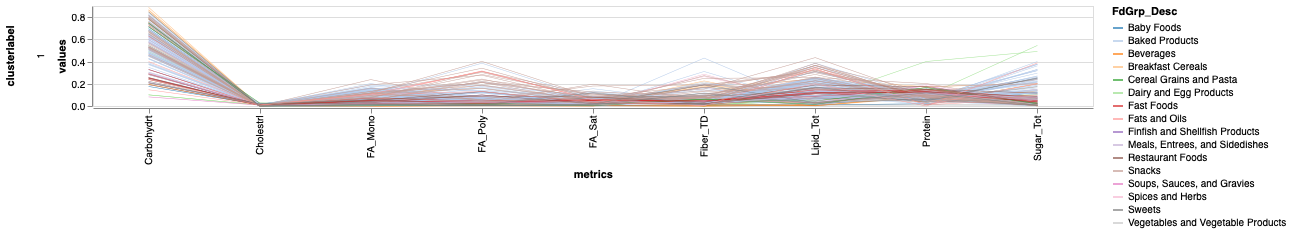
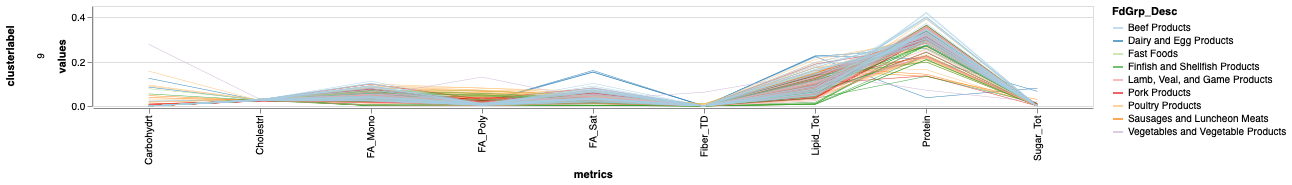
We used Parallel Coordinates to identify the Outlier and its nutrient composition in each clusters formed above.
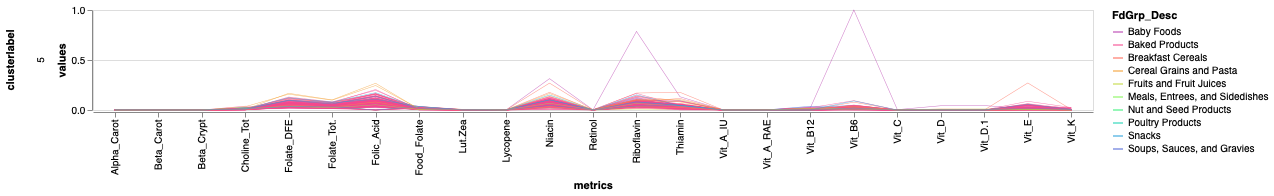
Vitamins Clusters Outlier :
Minerals Clusters Outlier :
Macronutrients Clusters Outlier :
Summary:
- Food groups were clustered into 12 clusters by vitamins, minerals and macronutrients.
- Each food-group was present in more than 6 clusters.
- In Vitamins cluster, Cluster 11 was high in Vit B12 , Vit B6 , Vit D.
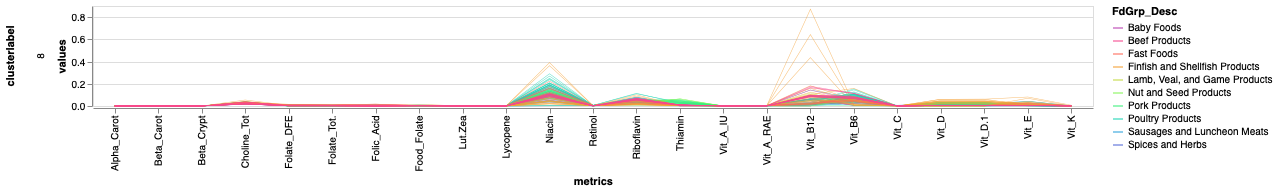
- In Minerals cluster, Cluster 8 was high in Copper, Iron, Magnesium, Manganese, Phosphorus and Potassium.
- In Macronutrients, Cluster 0 is high in FA_Mono, FA_Poly, FA_Sat, Fiber_TD, Fiber_Tot and Lipid_Tot
- In Vitamins clusters, outliers were identified in cluster 1, 5 and 8.
- Cluster 1 : Outlier is BreakFast Cereal and was high in RIBOFLAVIN
- Cluster 5 : Outlier is Baby Foods having high RIBOFLAVIN AND VIT B6 and Cereal grains and pasta having high Vit E
- Cluster 8 : Outlier is Finfish and Shellfish products having high Vit B12
- In Minerals clusters, outliers were identified in cluster 1, 3 and 5.
- Cluster 1 : Two Outlier is Finfish and Shellfish products having high Copper content.
- Cluster 3 : Outlier is Sweets and Vegetables and vegetable products having high Copper content.
- Cluster 5 : Outlier is Vegetables and vegetable products having high Copper content and Cereal grains and pasta having high Iron content.
- In Macronutrients clusters , outliers were identified in cluster 0 , 1 and 9.
- Cluster 0 : One outlier Sweets having more FA_SAT than remaining instances.
- Cluster 1 : Outlier is a Dairy Product having high Protein
- Cluster 9 : Outlier is as Vegetable product having high FA_POLY and FIBER_TD.